
NBA Steals and Blocks Props: Why Low-Volume Stats Deliver Higher Win Rates
 Available in US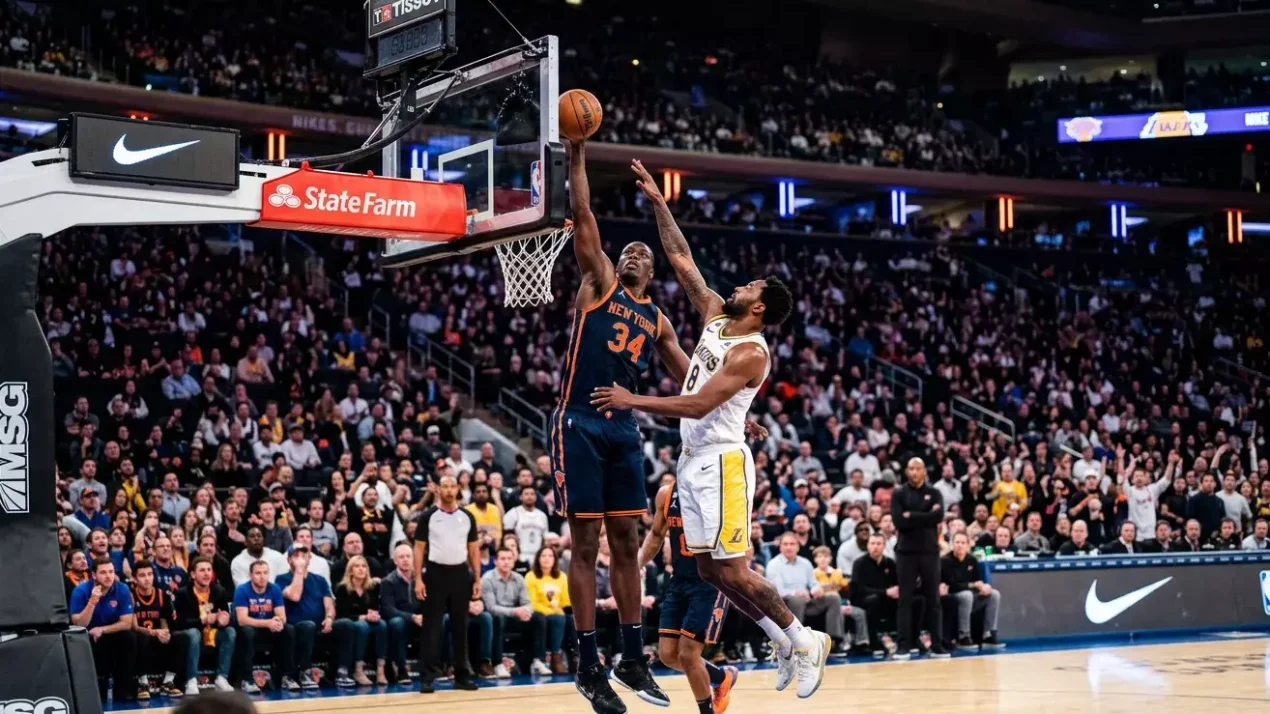
That disconnect — between prediction accuracy and betting volume — is exactly the kind of inefficiency that prop bettors should be exploiting. The reason these markets are underbet is psychological: low-volume stats feel unpredictable. A player who averages 1.3 blocks per game might have zero in one game and three in the next, which looks random if you are watching individual games without context. But the underlying factors — defensive role, matchup, and opponent attack patterns — are remarkably consistent. The models see that. Most bettors do not.
Understand how all props work in our NBA prop bets explained guide.
Why Defensive Props Are More Predictable
The counterintuitive truth about low-volume stats is that their very scarcity makes them easier to model. A player who scores 22 points per game does so through a complex mix of shot selection, rhythm, foul calls, and game script — all of which vary enormously. A player who blocks 1.5 shots per game does so because he is his team’s designated rim protector, the coaching staff positions him in the paint on every possession, and he faces a predictable number of interior shot attempts per game.
Defensive role specificity is the key. In modern NBA defences, the rim protection assignment does not rotate — it stays with one or two players all season. That consistency means the block opportunity rate for a primary rim protector is stable from game to game, varying mainly based on how often the opposing team attacks the basket. Similarly, steals concentrate on perimeter defenders whose role includes ball denial, hedge pressure, and passing-lane disruption. Those assignments do not change between Tuesday and Thursday.
The bookmakers know this, of course, but the lines still carry inefficiencies because the betting volume is thin. A points prop on a star player receives enough action from both sides to sharpen the line quickly. A blocks prop on a centre attracts a fraction of that volume, leaving the line closer to its opening position — which is often set with a wider margin. The NBPA has expressed concern that prop bets have become an increasingly alarming source of player harassment, both online and in person, and has called for a closer look at tighter regulations. From a bettor’s perspective, that harassment tends to concentrate on high-profile scoring props; defensive stats fly under the public radar, which paradoxically keeps those markets less efficient and more exploitable for disciplined bettors.
Blocks Props: Rim Protectors and Matchup Value
I have a simple rule for blocks props: identify the primary rim protector and check who is attacking the paint on the other side. That single step answers most of the question. A centre who averages 2.1 blocks per game facing a team that generates 45% of its shots within five feet of the basket is going to see more blocking opportunities than when he faces a perimeter-oriented offence that takes 55% of its shots from outside the paint.
Interior scoring rate is the metric to track. Teams that drive aggressively — through pick-and-roll action or isolation plays into the lane — create more contests at the rim, which translates directly into block opportunities. The connection is almost mechanical: more drives mean more shot attempts near the basket, and more rim-area attempts mean more chances for the opposing centre to alter or reject those shots.
Minutes stability matters too. Centres in foul trouble sit on the bench, which eliminates block opportunities entirely for stretches of the game. A centre who averages three fouls per game is a riskier blocks prop than one who averages 1.5 — not because his blocking ability differs, but because his available minutes are less predictable. Check foul rates as part of your pre-game analysis; it takes ten seconds and filters out a common source of variance. For more on how player prop strategy accounts for these variables, the pillar guide covers the full framework.
Steals Props: Perimeter Defenders and Turnover-Prone Opponents
Steals operate on different mechanics than blocks but follow the same principle: the opportunity is determined by the matchup, not just the player. A guard who averages 1.4 steals per game will generate more steal opportunities against a team that turns the ball over 16 times per game than against one that turns it over 11 times. Opponent turnover rate is the single strongest predictor of individual steal output, and it is publicly available data that you can check in thirty seconds.
The type of turnovers matters too. Some teams give the ball away on backcourt violations and offensive fouls — turnovers that do not generate steals. Others are careless with entry passes, cross-court skip passes, and dribble handoffs — exactly the situations where an active perimeter defender can jump a passing lane. If you want to go deeper, track the opponent’s live-ball turnover rate specifically. That number correlates more closely with steal opportunities than the headline turnover figure.
Pressing defences create their own steal opportunities. Teams that employ full-court or half-court pressure force more turnovers and distribute steal chances across their backcourt. If you are betting on a guard playing for a pressing team, his steal prop may be slightly more predictable because the defensive scheme generates consistent opportunities regardless of the individual matchup. The scheme does the work; the player collects the stat.
One final angle: fatigue compounds carelessness. Teams playing the second night of a back-to-back or the tail end of a long road trip tend to commit more live-ball turnovers in the second half, which inflates steal opportunities for the opposing backcourt. If you combine a pressing defence with a fatigued opponent, the steal prop for the primary ball-denial guard moves from a coin flip to a high-confidence play.
Visit betting on nba players for defensive stat props.
Defensive Props FAQ
Why do bookmakers set tighter lines for NBA steals and blocks?
Steals and blocks are low-volume stats — most players average between 0.5 and 2.5 per game — which means the lines cluster around small numbers (0.5, 1.5, 2.5). The bookmaker sets a tight line because any movement of 0.5 represents a significant percentage change. The juice on these lines tends to be higher as well, compensating the bookmaker for the thinner volume and the binary nature of the settlement — a player either hits 1.5 blocks or he does not, with little middle ground.
Are blocks and steals props available for same-game parlays?
Yes, most major UK-licensed sportsbooks include blocks and steals props in their same-game parlay builders. These defensive stats can be combined with other player props or game-level markets. Because blocks and steals have relatively low correlation with scoring props for the same player, they often pass the bookmaker’s correlation checks and are allowed as separate legs. This makes them useful additions to multi-leg parlays where you want diversified stat categories.
This material was created by the CourtEdge team.
Related posts

NBA Betting Glossary for UK Punters: Every Term You Need to Know
British Basketball League Betting in the UK: Markets, Coverage, and Differences from NBA